Visualise your fitted
non-linear dimension reduction model
in the high-dimensional data space
Motivation
Single-cell gene expression: same data, different NLDR + hyper-parameters
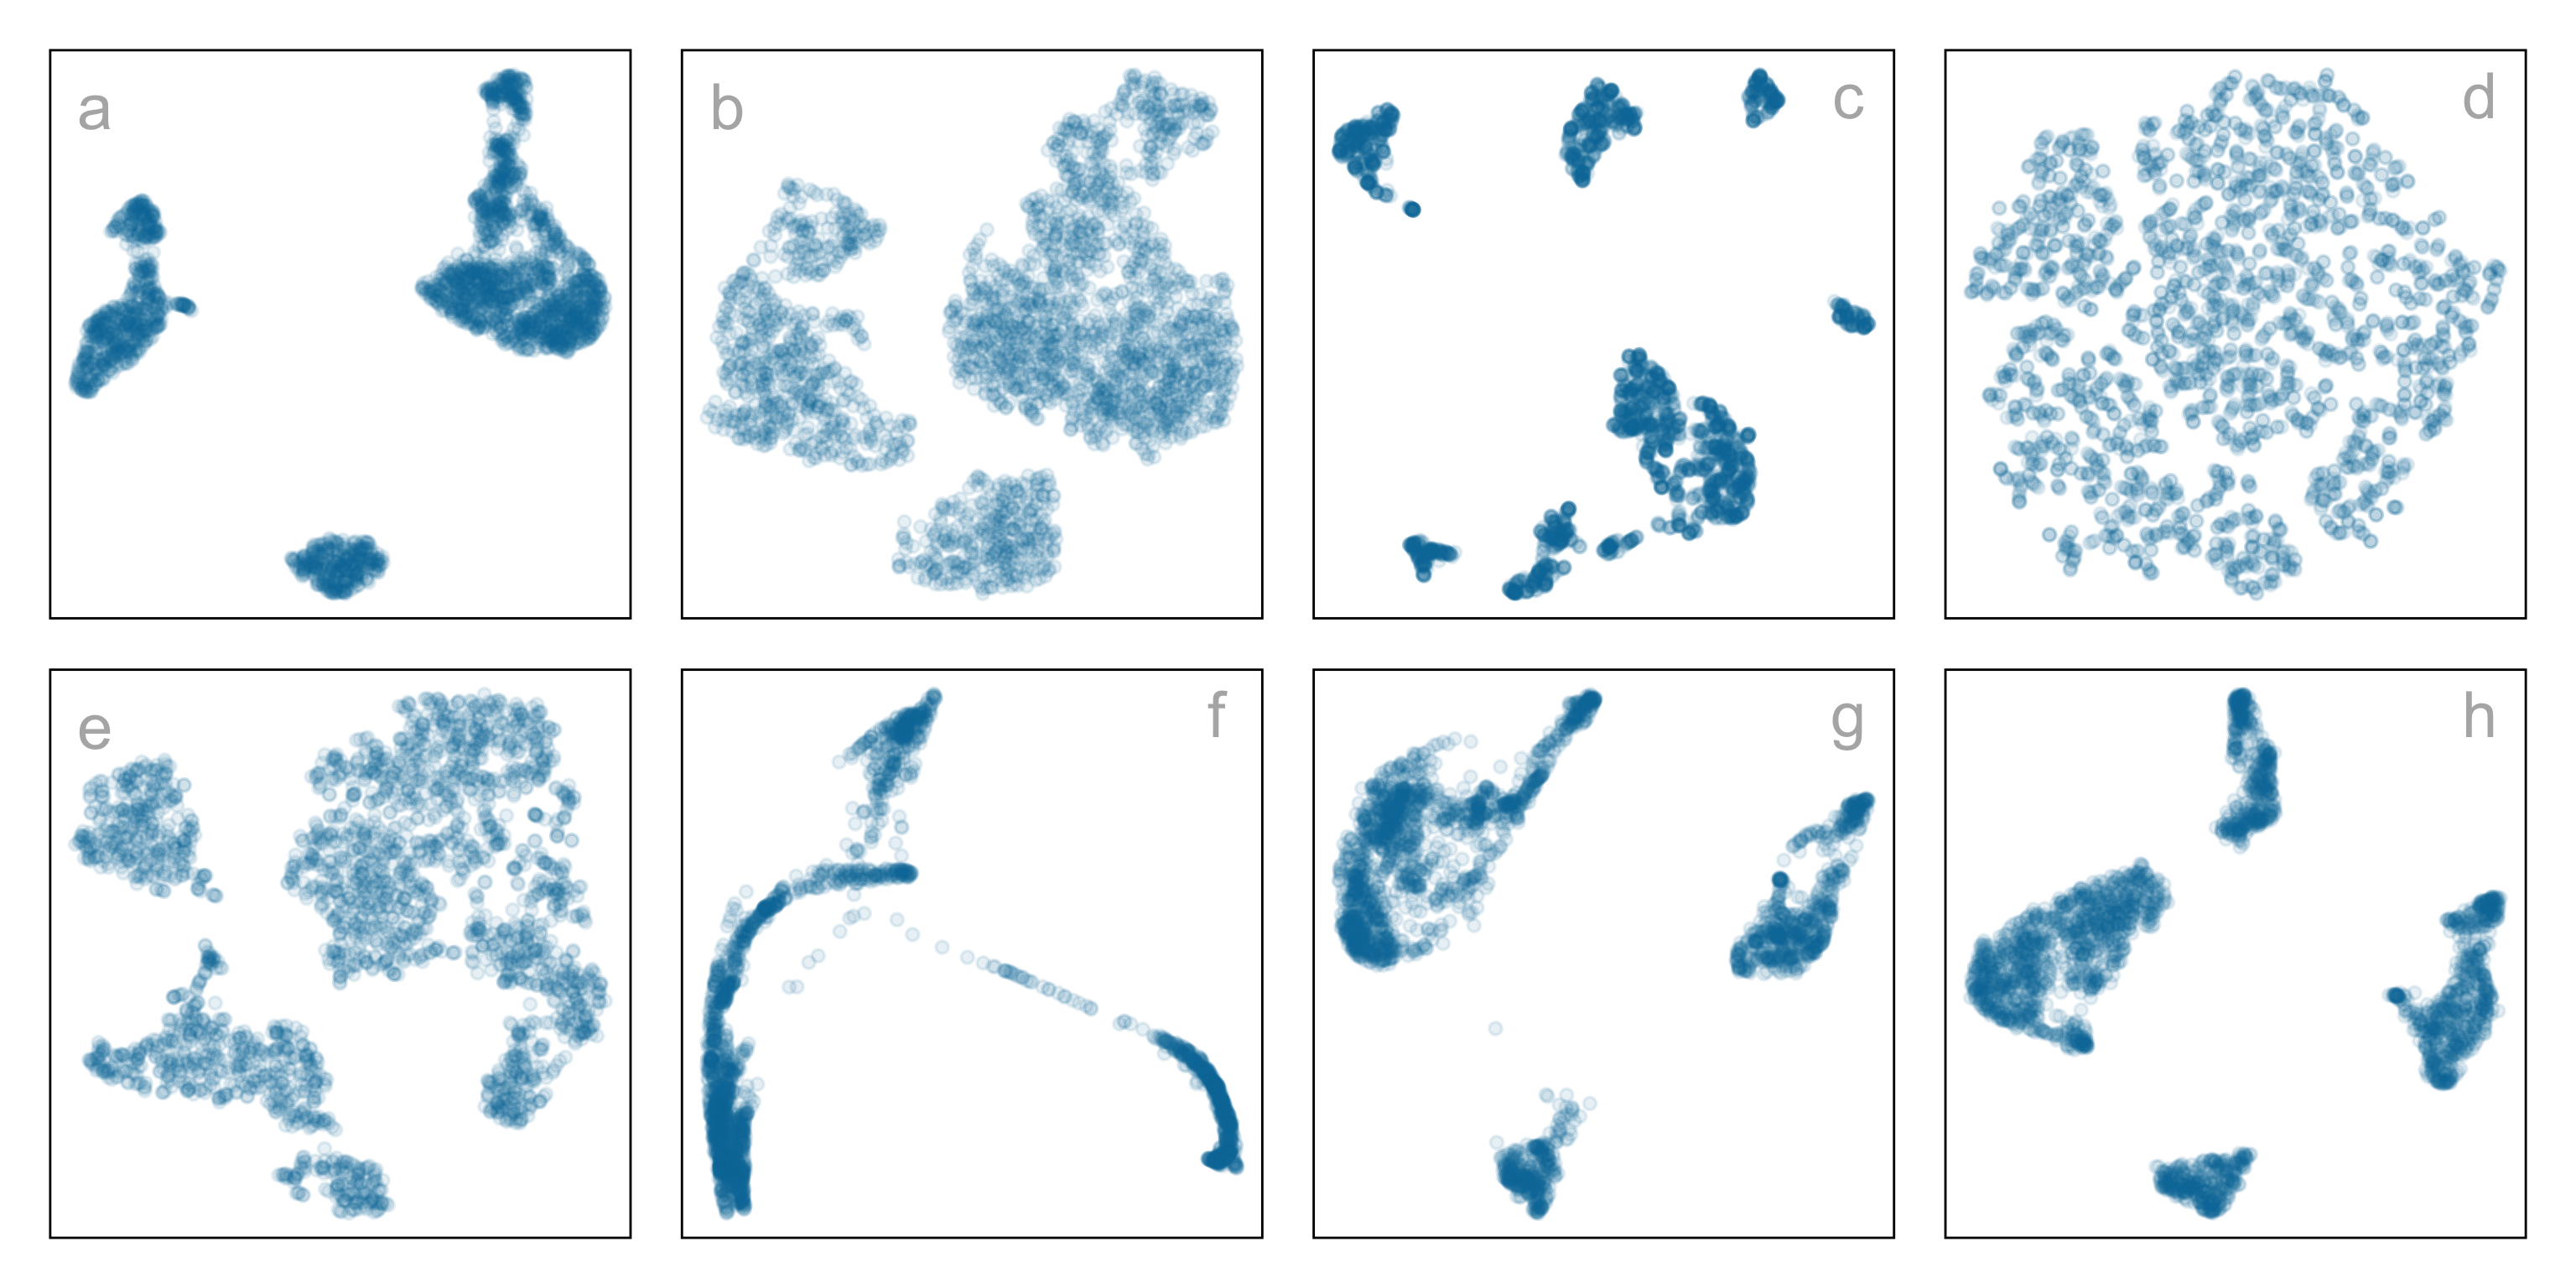
Which is the most reasonable representation of the structure(s) present in the
high-dimensional data?
data-in-the-model-space
model-in-the-data-space
data-in-the-model-space

What is the model?
data-in-the-model-space

model-in-the-data-space
Overview of method
1. Construct the \(2\text{-}D\) model
2. Lift the model into high-dimensions
Steps of the algorithm
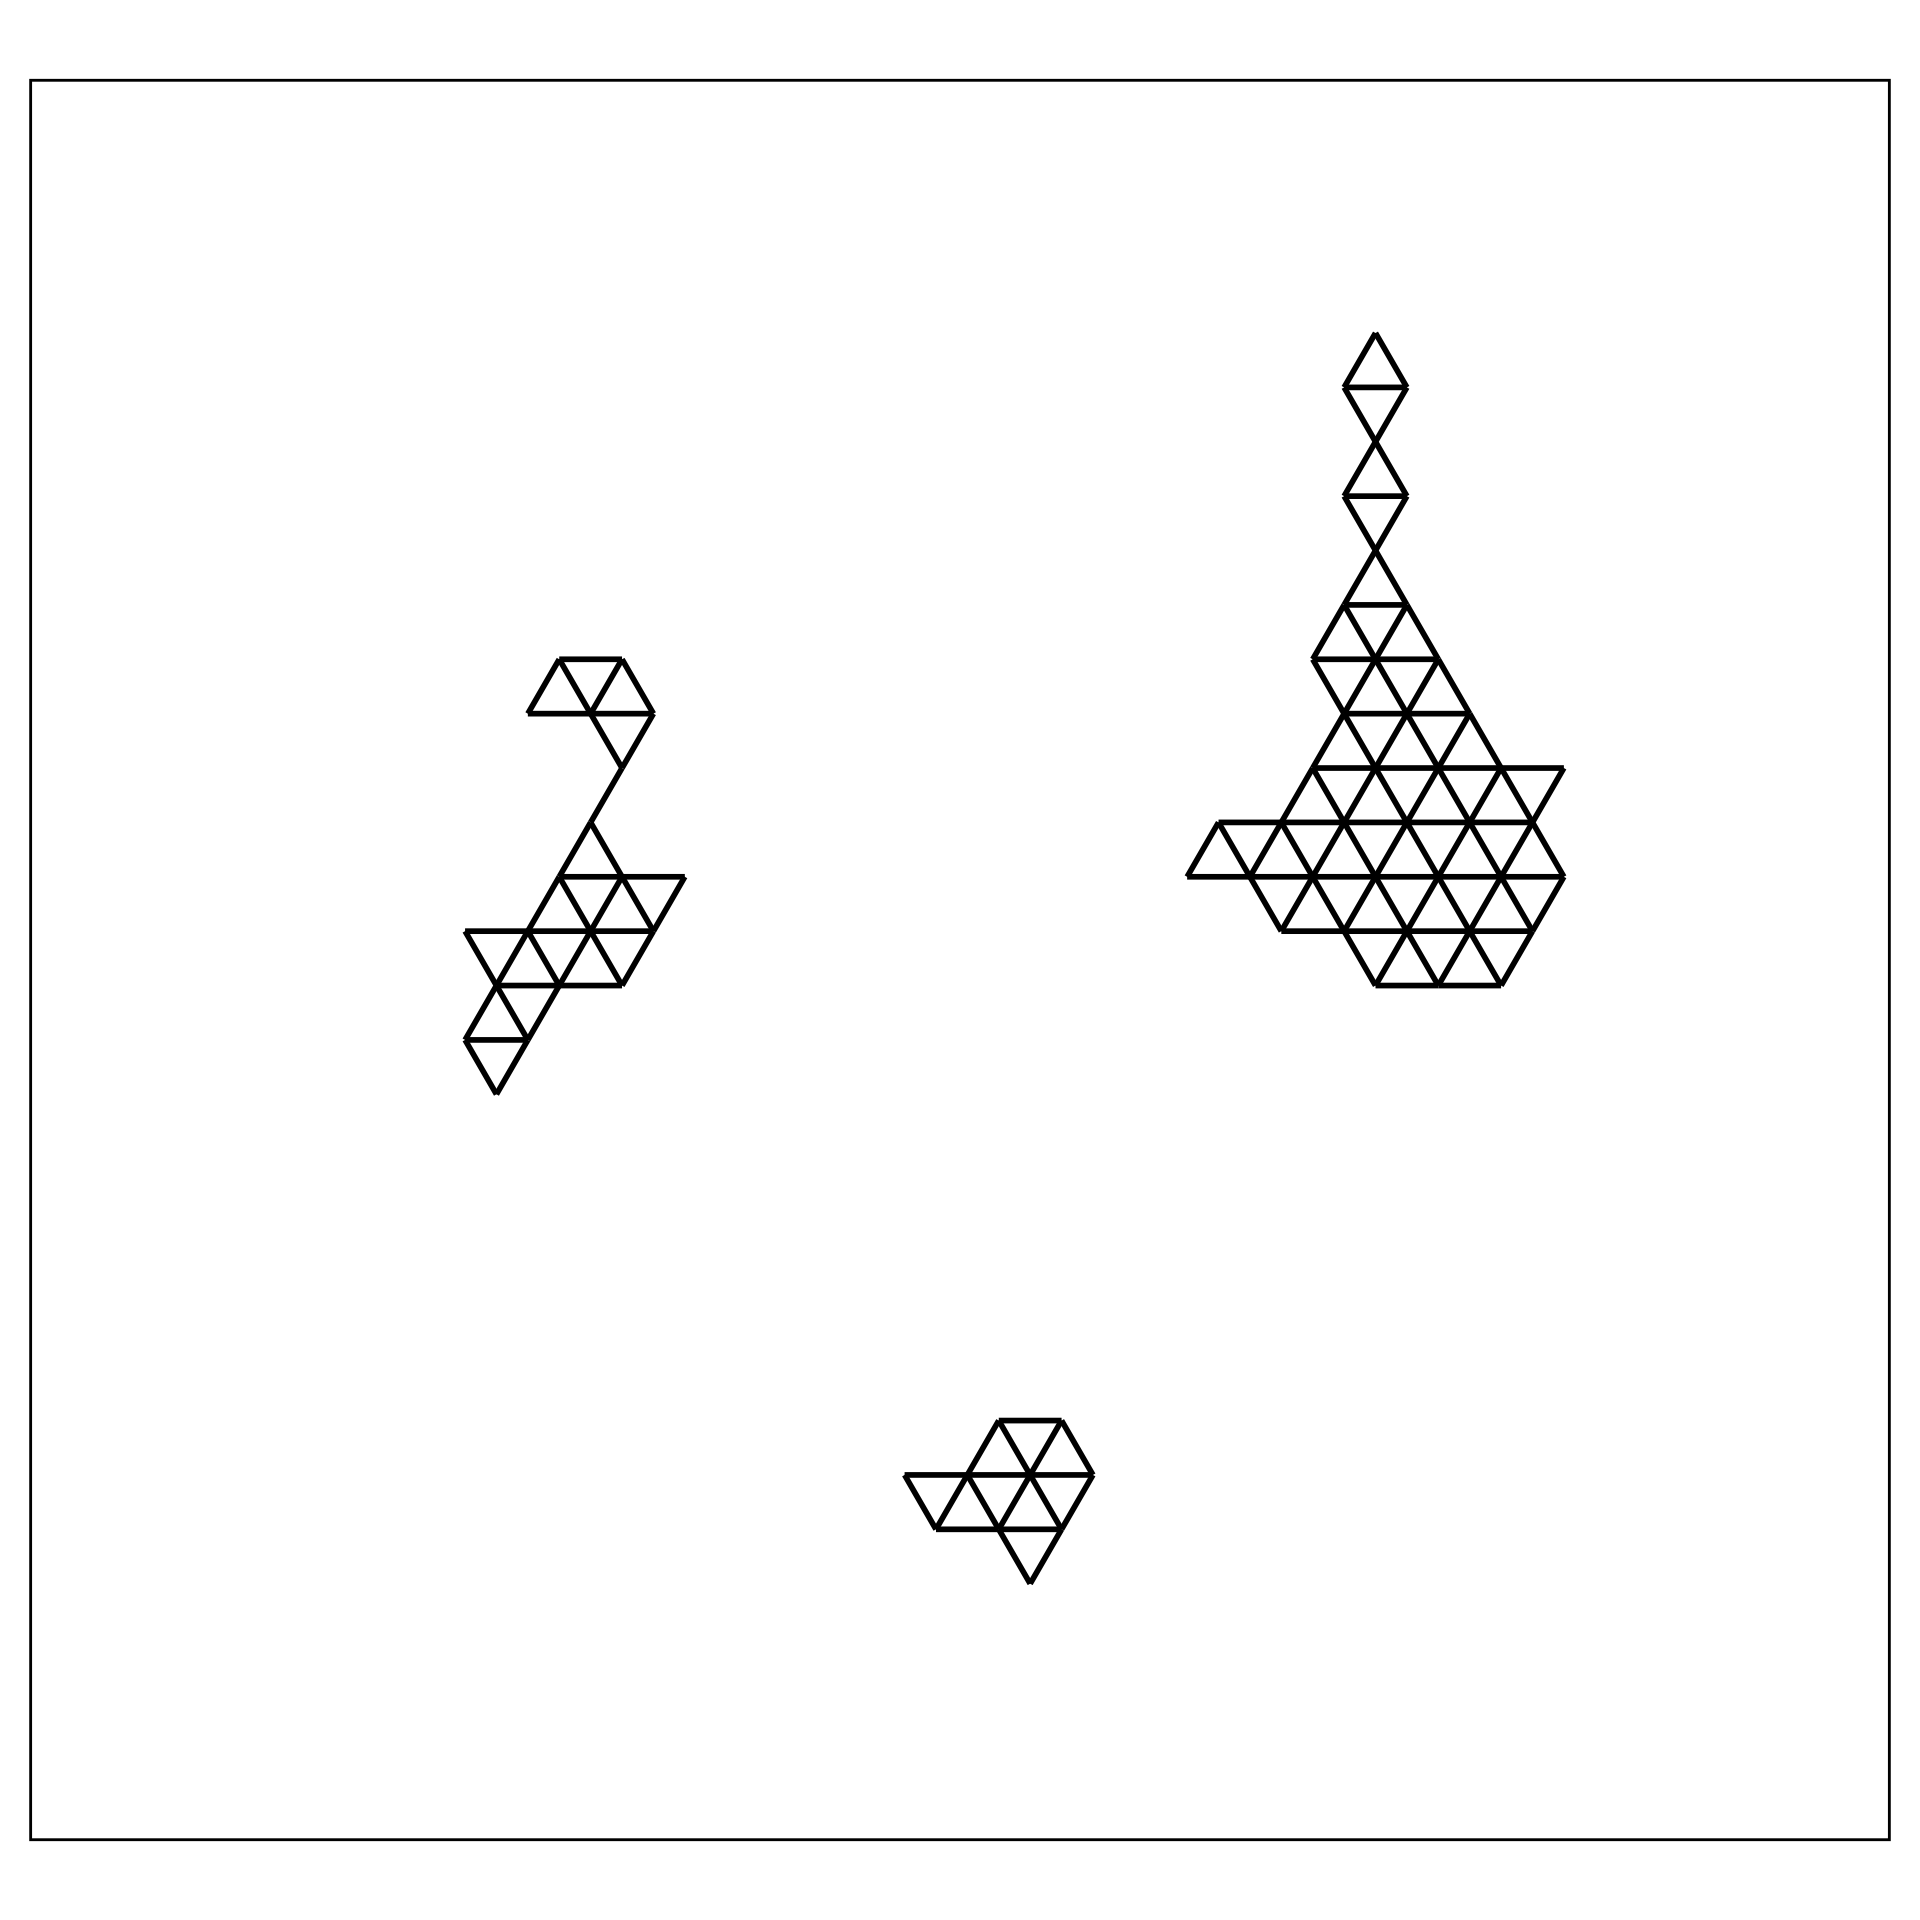
1. Construct the \(2\text{-}D\) model

- NLDR layout, b. hexagon bins (
hex_binning()andgeom_hexgrid()), c. bin centroids (merge_hexbin_centroids()), d. triangulated centroids (tri_bin_centroids(),gen_edges(),update_trimesh_index(), andgeom_trimesh()).
Steps of the algorithm
2. Lift the model into high-dimensions
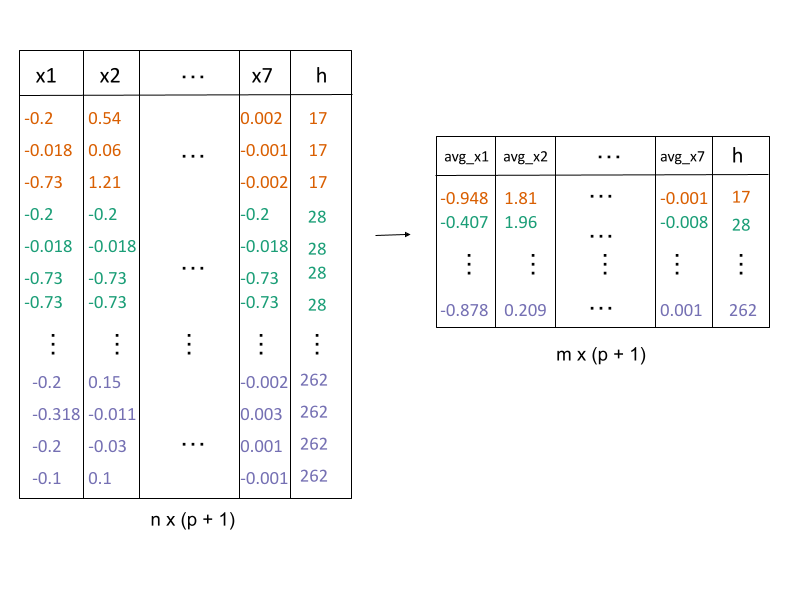
avg_highd_data()
show_langevitour()
HBE of candidates

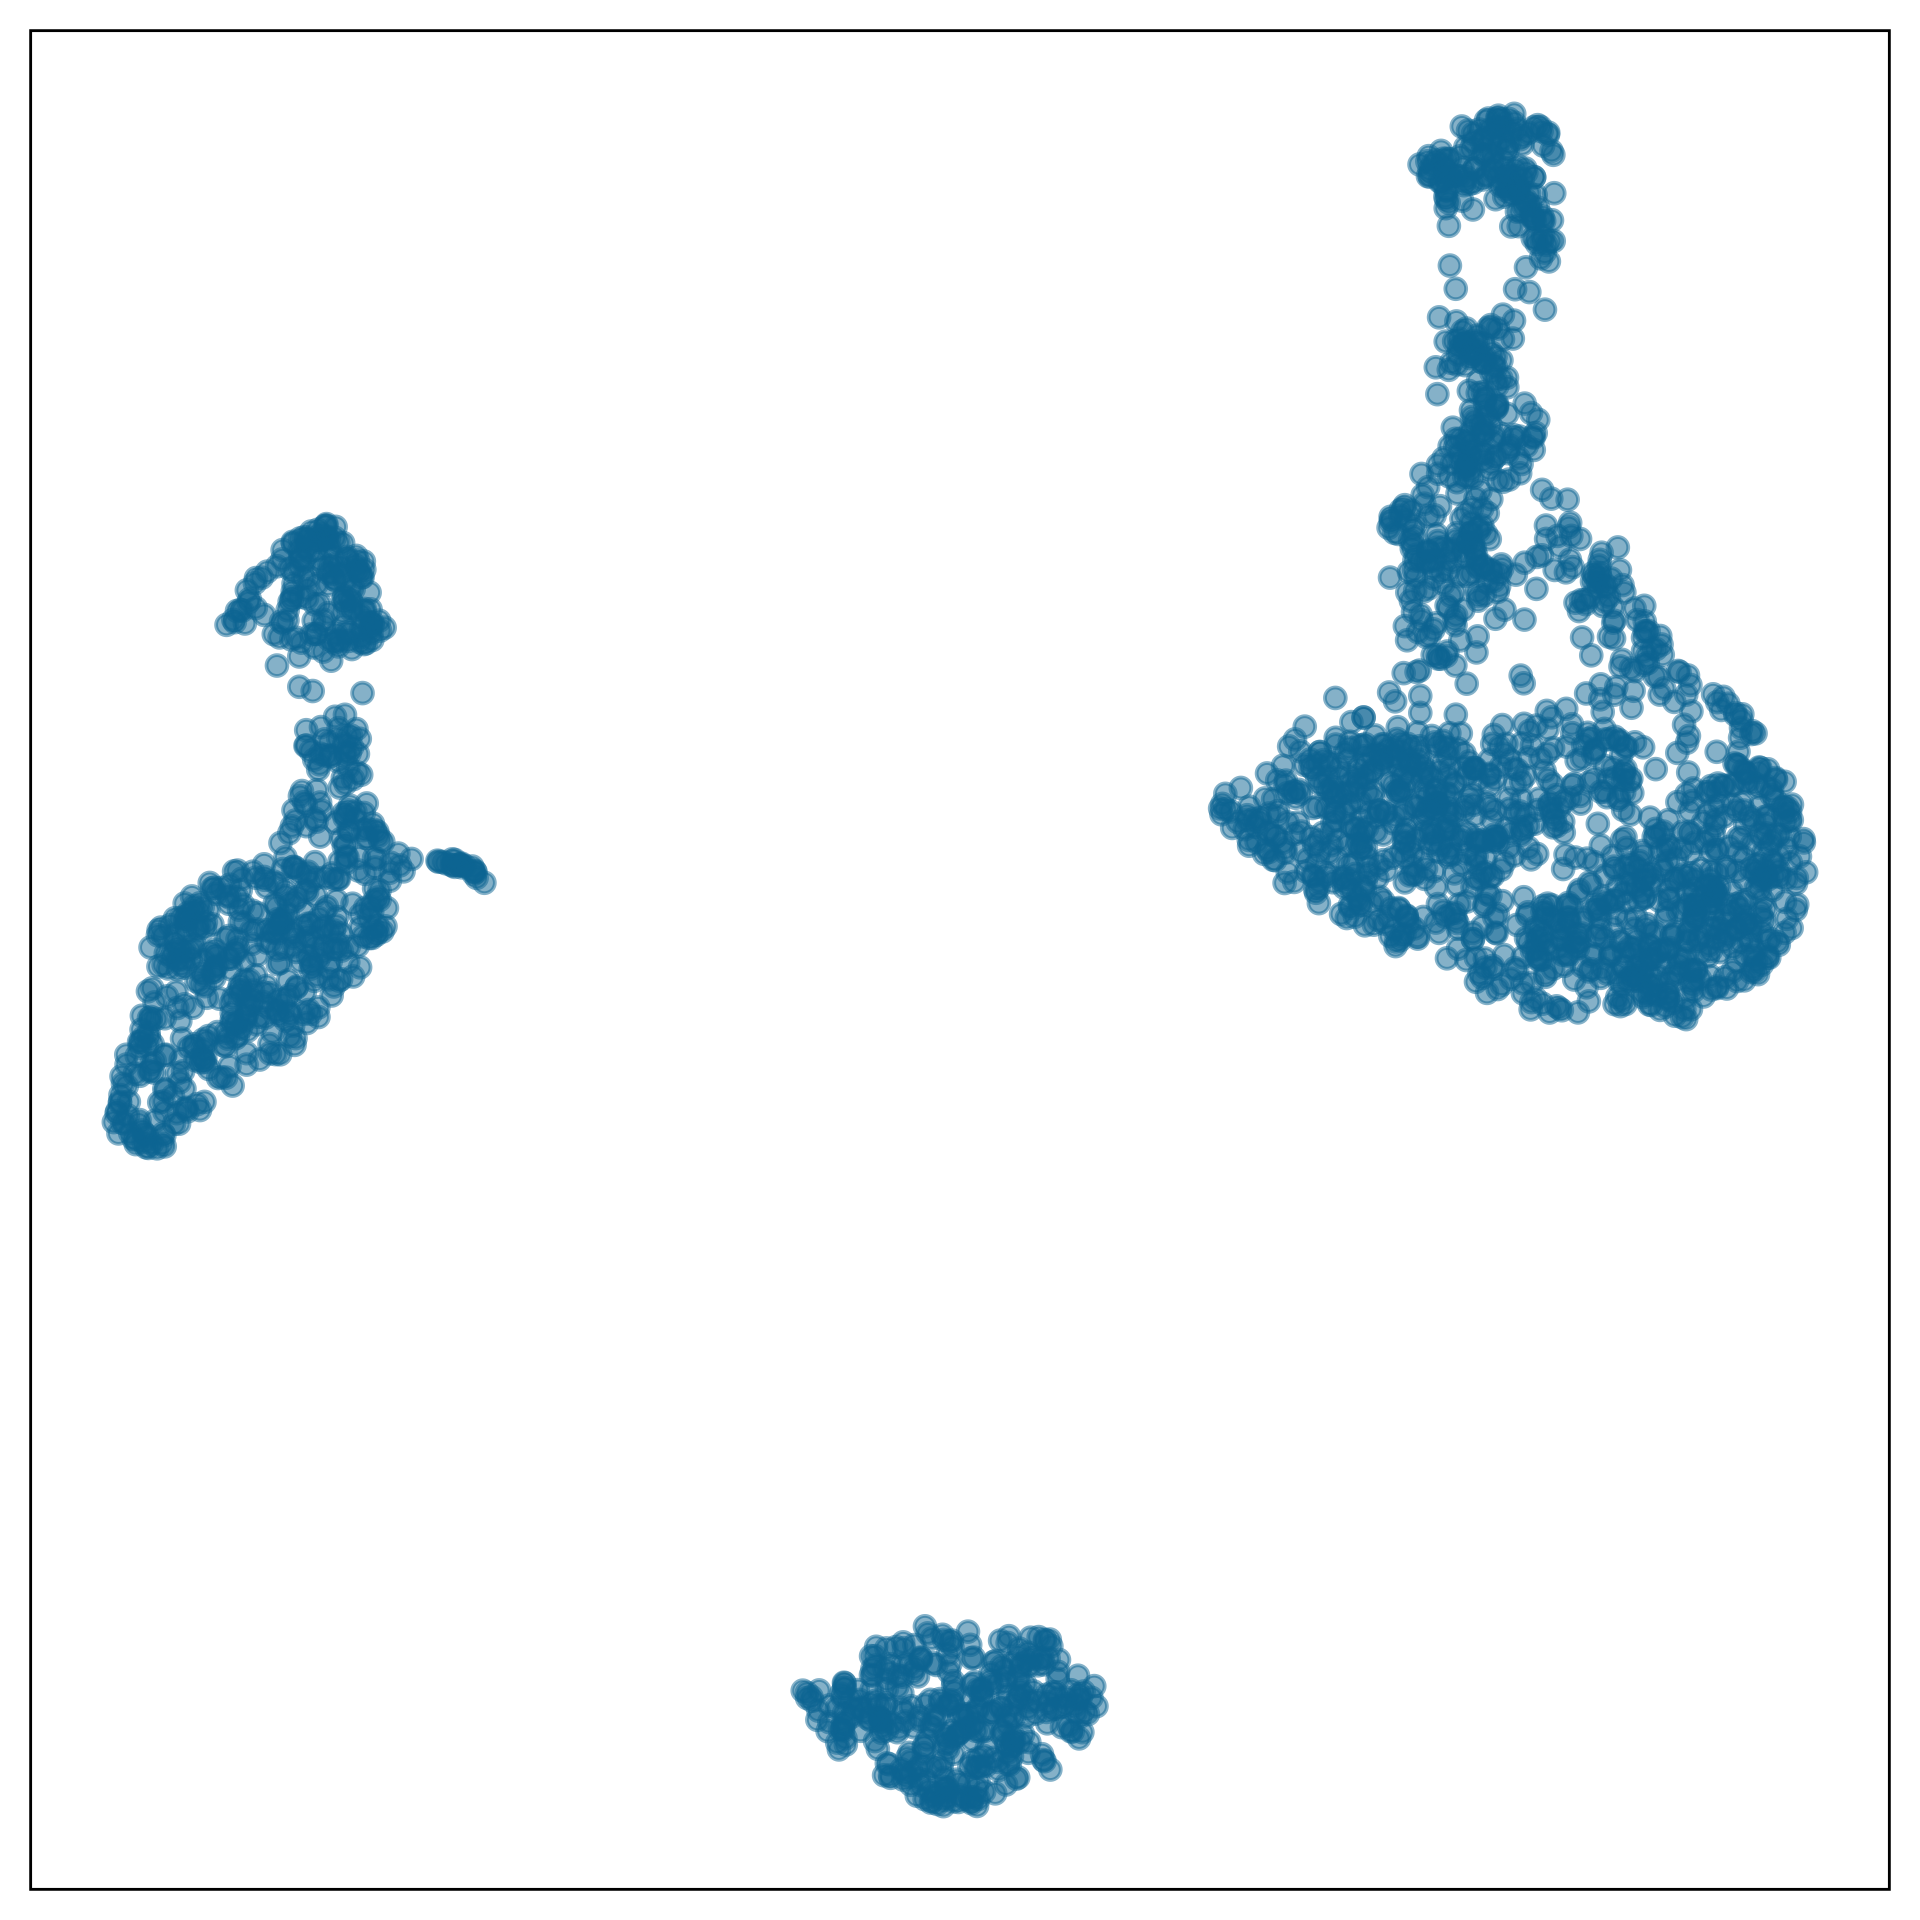
Chosen fit for PBMC data set
tSNE with perplexity: 30

Clusters with small separations, non-linear clusters
Densed points, filled out clusters
Prediction into \(2\text{-}D\)
Predict a new observation’s value in the NLDR, for any method (
predict_emb())For a new observation
- Determine the closest bin centroid in high-dimensions using fitted model
- Predict it to be the centroid of this bin in \(2\text{-}D\)

![]()

quollr
questioning how a high-dimensional object looks in low-dimensions using r
Summary
- Provided a method to create a model from a NLDR layout that
can be displayed with the data to assess the fit.
- Make it easier for researchers to make better decisions on which
NLDR layout is best for their work.
- It has the additional benefit that for any method you can now
provide predictions for new data, of where these points will be
positioned in the NLDR.

R package

Draft paper

Jayani P.G. Lakshika 
Collaborators: Prof Dianne Cook, Dr Paul Harrison, Dr Michael Lydeamore, Dr Thiyanga S. Talagala